Sub-question
The controversy around global warming and hurricanes extends to the very question of: how to measure the intensity of hurricanes?
As it is a controversy that gathers many scientific and non-scientific domains, the word “intensity” covers many aspects although it has the same defining aim: hurricanes are or are not getting stronger and causing more damage. But as we look closer to the measurement tools used by these actors, we can notice that there is a diversity of definitions and understandings of the word “intensity”.
By analyzing the time period through which actors of the controversy define the intensity of hurricanes, one can easily observe that during, right after and before the next one are 3 time periods where tools, measurements and definitions are not the same.
Scientists and non-scientists have different ways of measuring the intensity of hurricanes depending on when they refer to it.
DURING
The Saffir-Simpson Hurricane scale was created in 1971 by the meteorologist Bob Simpson. It categories the strength of hurricanes thanks to the measurement of their wind speed and storm surge. There are 5 categories of hurricanes; starting from wind speeds at 118km/h to 252km/h. Categories 3, 4, and 5 are considered as highly damage-causing. The scale was first designed to evaluate the damage caused by hurricanes to manmade structures. Many scientists like Emanuel Kerry criticized the Saffir-Simpson scale arguing that it does not take into accounts occurring precipitations nor the size of the storm itself. After the 2005 Hurricane season which was particularly violent, some scientists suggested to create a 6th category for storms above 280km/h wind speed.

Satellites are used to determine the evolution and pathway of hurricanes. They give indications on the physical size and forecast landfalls.
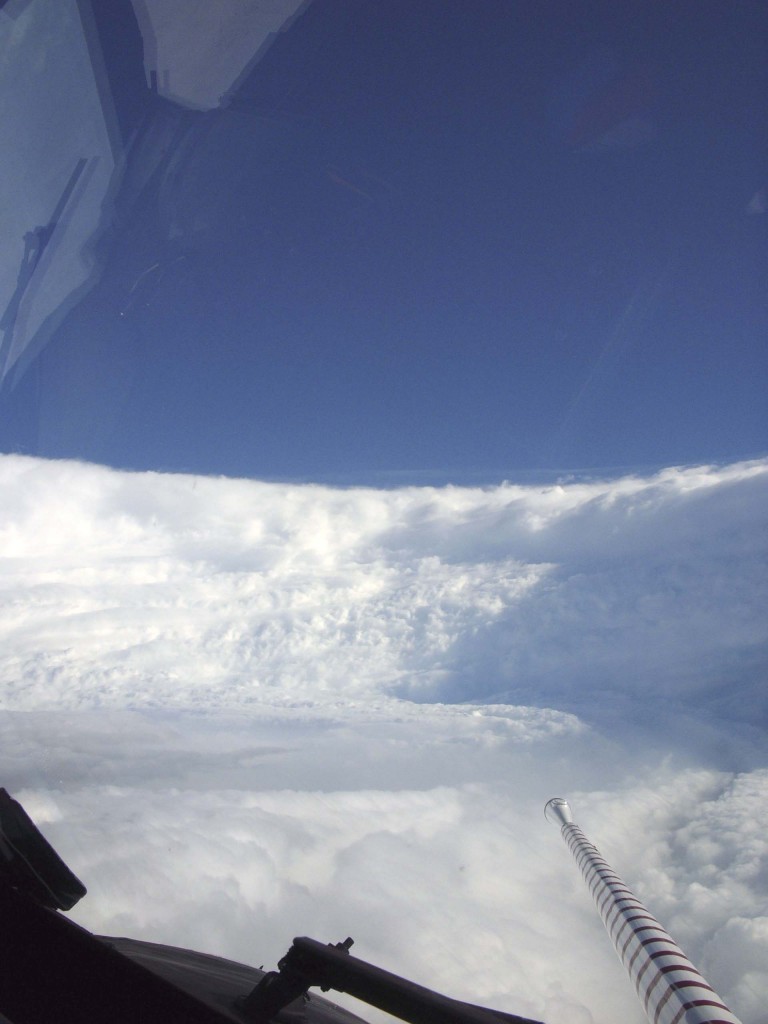
“Hurricane Hunters” are aircrafts sent by the NOAA and that belong to the US Air Force. As opposed to satellites, aircrafts can give information on the pressure and wind speed of hurricanes. They are the fastest way to collect data and predict the evolution of hurricanes, thanks to tools they have on board and the drop-sonde that they release in the eye.
AFTER
How to measure the damages caused by hurricanes?
In order to measure the damages of hurricanes right after catastrophe modeling companies are developed to measure the financial impact of such events on infrastructures. ‘Cat models’ usually include three modules: the hazard module looks at the physical characteristics of potential disasters. In the case of hurricanes, data on the past frequency, intensity and location are used to predict a 10 000 years scenario. The vulnerability module assesses the potential damages on buildings when confronted to natural catastrophes. The characteristics of the buildings serve as indicators of their vulnerability. Potential damage is computed after simulating an event of a given magnitude. The financial module calculates the loss distribution by multiplying the damage ratio distribution for a given event by the building replacement value. Indeed, specific insurance policy conditions are incorporated to give more accurate predictions. Such simulations are great tools as forecast and evaluation of hurricane damages.
Source : http://understandinguncertainty.org/node/622
The economic impact of hurricanes in a given period and location depends on several factors, that can include the number and the intensity of storms, the geographical features of the affected location, the number of infrastructures, the economic activity, etc. The potential damages can change over time along with shift in coastal migration, building values, adaptation policies, building code enforcement or not, etc.
In the aftermath of a hurricane, direct impacts such as the destroyed infrastructures and loss of life are generally easier to estimate. Debris removal, insurance and federal payouts and aids are means of measurement. However, indirect or secondary impacts are less obvious, since they result in the days and weeks following the disastrous event and need more estimation. Further impacts on longer time scales can of course occur. Typically, direct losses are building damages, bridge collapses, highways and roads destruction, loss of lives. The indirect losses follow these first damages. For example, agricultural areas can be destroyed and this will have further impact on productivity, leading also to prices rise. Another impact that can be easily imagined is the decrease of tourism activity in the devastated area. Several factors can converge afterwards and can leave an imprint that may linger for years, which make it almost impossible to estimate the damages with certainty.
Whether it is before or after a hurricane occurs, ‘cat models’ combined tools using the latest Geographic Information Systems (GIS) are increasingly used to estimate physical damage, economic loss as well as the social impact (displaced population for instance).
Models and software manage hurricane and other natural disaster risks, such as the hurricane loss model funded by the Florida Office of Insurance Regulation, Hazus provided by the Federal Emergency Management Agency (FEMA), models by Air Worldwide, etc. The clients are insurance and reinsurance companies, governments but also financial and corporate clients.
Press Coverage
Extreme weathers and natural disasters are very ‘photogenic’. They are of course widely reported in the news: from all the traditional media to Internet and today’s social media. To some extent, the over-estimation of losses in the aftermath of a hurricane may be driven by the media. Media coverage for the latest Hurricane Irene (2011) has even been criticized for having gone overboard.
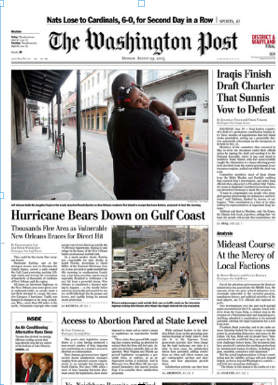
The media thus participate to the concept of intensity of a hurricane as they might emphasize statistics and political response to catastrophes. Katrina in 2005 remained as one of the most devastating hurricanes in the minds of people also because of the US Government’s late reaction, and the way it was mediated through National news channels/media.
The Washington Post front page, Hurricane Katrina (August 29th 2005)
New York Times front page, Hurricane Irene (August 28th 2011)
Response of the Government after Hurricane Katrina on CNN, August 2005:
 New York Post and Daily News frontpages, Hurricane Irene (August 2011)
FORECAST AND SIMULATION
Climate models are computer numerical programs that produce meteorological information for future times at given locations and altitudes.
GLOBAL MODELS:
Scientists like Thomas Knutson recognize that there has been an increase in Sea Surface Temperature (SST) over the 20th century of roughly 0.5°C. Already in 1998 Henderson-Sellers et al. published a study at the WMO saying that there was a potential intensity increase of tropical cyclones (between 10 to 20%). In 2001, the IPCC stated that it was likely to observe in the future an increase of tropical cyclones peaks in wind and precipitations intensity.
In order to simulate future hurricane behaviors, he uses Global Climate Models (GCM) focusing on the number of tropical storms and their wind speed. To look at the frequency change he uses Gray’s genesis parameters, and to determine intensity variations he uses the Emanuel Holland Potential Intensity theories.
Considering frequency, the results are inconsistent, they found no evidence that tropical cyclones would be more numerous (Tsutsui, 2002). However, considering the intensity, they did find out through simulations and experiments that an increase in SST would lead to an increase in wind speed.
Their simulations are operated with a Geophysical Fluid Dynamics Laboratory (GFDL) hurricane model, building a 9km grid around the eye of the storm, and taking into account the sea surface temperature, the wind speed and the precipitations. Their results show an increase in the risk of highly destructive category 5 storms. Tropical seas have warmed up because of anthropogenic forcing, and it leads to an increase in maximum intensities (1/2 category per 100year) and in storm precipitation (18% per 100year).This is for the global theory. But in order to find out by regions, scientists of the NOAA use nested regional models (such as the GFDL Zetac Nonhydrostatic Regional Model).
Frequency
Yearly genesis parameter (YGP), Convective yearly genesis parameter (CYGP) and Genesis Potential Index (GPI)
Proposed by Gray in 1975, it is an empirical diagnostic tool used to infer tropical storms’ frequency, or the number of tropical storms formed in a 5°x5° latitude-longitude grid for a given 20 year period. Gray identified six factors which contribute to tropical cyclogenesis : three dynamical factors (coriolis force, vertical shear of the horizontal wind and low-level vorticity) and three thermo-dynamical factors (related to the sea surface temperature (SST), moist stability and mid-tropospheric humidity). The six factors are combined into a single parameter called YGP.
In 1998, the Convective Yearly Genesis Parameter (CYGP) was elaborated at the Centre National de Recherche Météorologique (CNRM) from the Yearly Genesis Parameter of Gray (Royer et al.) to address more specifically climate change. Similarly to the Gray’s YGP, the CYGP infers the number of tropical cyclones formed in a 5°x5° latitude-longitude grid for a given 20 year period. However, it combines the aforementioned three dynamical factors to a convective potential which is the measurement of the intensity of the convection as computed in the model. It was thus used to study the impact of global warming in models. Since then, the Genesis Potential Index (GPI) have been proposed by Emanuel and Nolan (in 2004), which also shows a good representation for cyclonic activity. For the thermal factors, relative humidity and the concept of Potential Intensity (PI) are used.
Source: Hurricanes and Climate Change (James B. Elsner)
REGIONAL MODELS
Regional models cover smaller areas, with higher spatial resolution than global models, although they have to rely on them.
The model that is the most used by Pielke Sr. (working at the CIRES) is a regional model called Regional Atmospheric Modeling System (RAMS). Developed under the direction of Roger Pielke and William Cotton, this mesoscale model is used notably for weather predictions, climate assessments, and also for hurricanes simulations for instance. Developed at the Colorado State University, the model is now supported in the public domain. It is a limited-area model, but may be configured to cover an area as large as a planetary hemisphere for simulating mesoscale and large scale atmospheric systems.
Source : Introduction on RAMS by the Colorado State University. Available online at: http://rams.atmos.colostate.edu/rams-description.html
The Weather Research and Forecasting (WRF) Model (used by the NCAR) is a mesoscale numerical weather prediction system. It serves forecasting and atmospheric research. WRF is suitable for a broad spectrum of applications across scales ranging from meters to thousands of kilometers. WRF allows researchers the ability to conduct simulations reflecting either real data or idealized configurations. WRF provides operational forecasting a model that is flexible and efficient computationally, while offering the advances in physics, numerics, and data assimilation contributed by the research community.

