Timeline
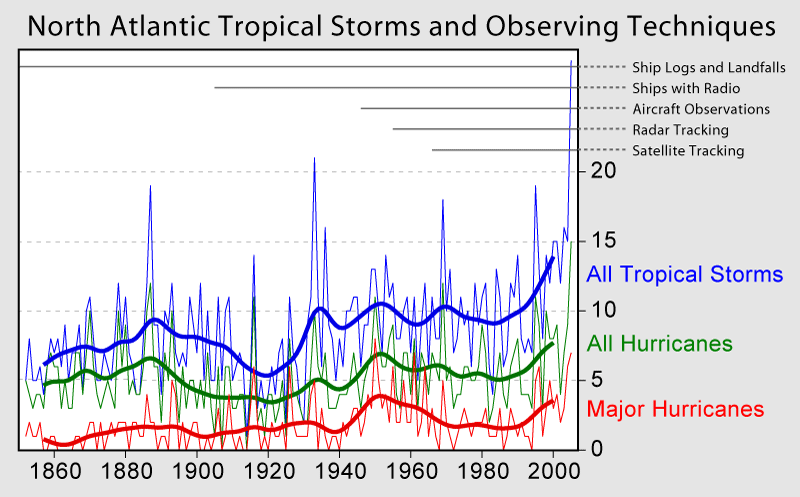
North Atlantic Tropical Storms evolution (1860-2000)
This figure was prepared by Robert A. Rohde from published data and is made available under the Global Warming Art license. It shows a slow but notable increase in both tropical storms in general and hurricanes specifically in recent years. The last spike was around the 1950s, but recent research gives reason to believe that the hurricane frequency, in particular the strong hurricane frequency is likely to continue its increase.
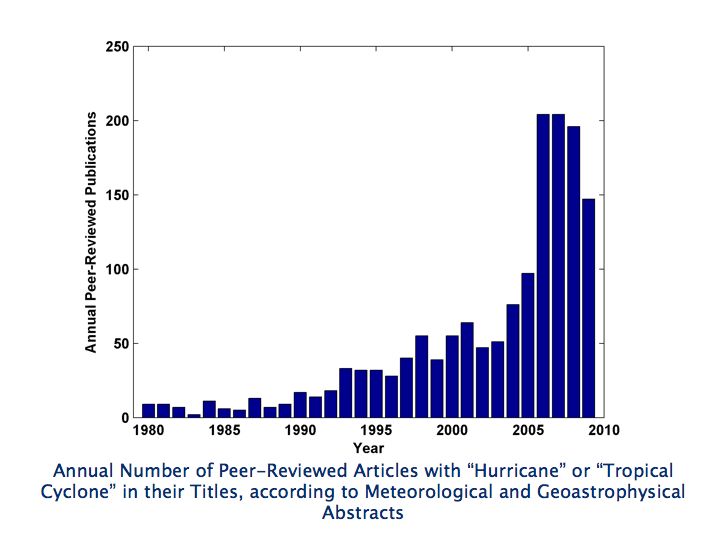
Hurricane-related publications timeline (1980-2010)
This graph represents the amount of publications on climate change and hurricanes since 1980. As aforementioned, the interest in this question expanded greatly after 2005 and especially with Hurricane Katrina. When looking at this graph in comparison with the previous one, it can be noted that there has been an increase in scientific publications concerning hurricanes. The most notable spike is in 2007, around the time when Katrina hit the North Atlantic American coast. The graph shows nevertheless a quick increase in interest in hurricane research ever since the 1990s that is not related to Katrina itself but to a general increase in strong hurricanes.