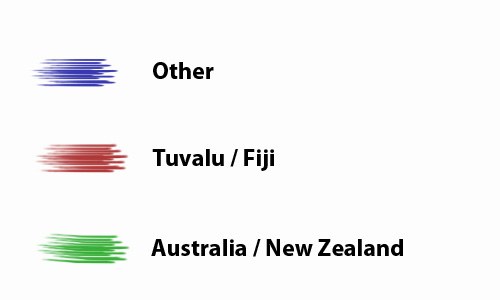
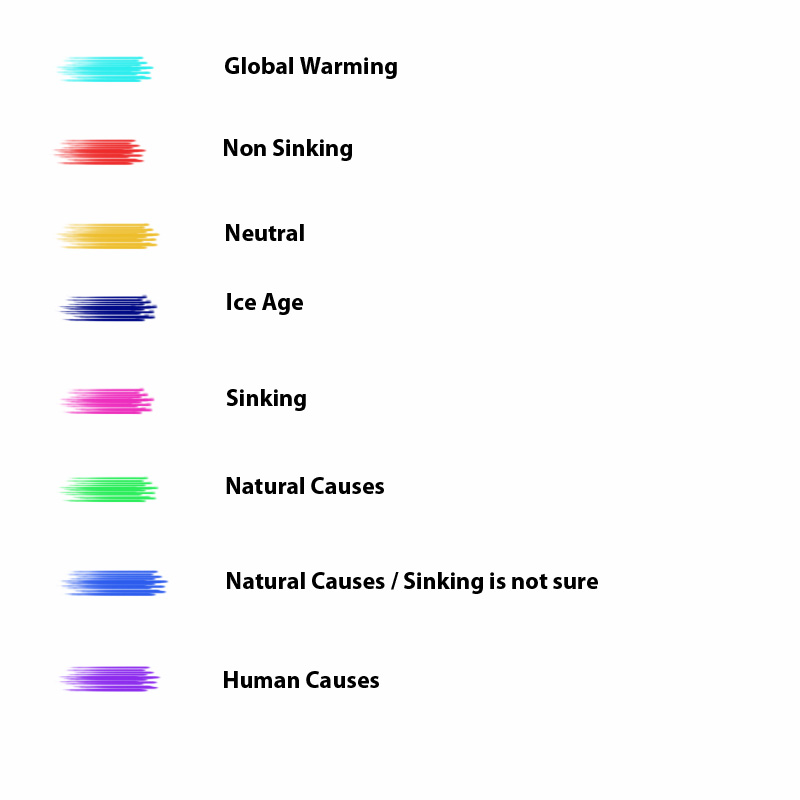
Network analysis consists in mapping the way actors or commentators of a particular issue are organised and connected on the Internet. It gives a general view of the structure of the network.
Graph 1:
Legend:
Graph 2:
Legend:
Legend:
The graph representing the network of the Tuvalu controversy’s actors is made of two loosely connected groups of nods surrounded by an almost circular ring of unconnected websites. In the middle is the Climate Network website and a small group composed of the main research centres producing data and studies on the Tuvalu islands notably on the sea-level evolution in South Pacific.
The first group, located on the bottom left of the graph, can be broadly described as the pro-Tuvalu one in the sense that it is mainly composed of associations and NGOs supporting Tuvalu in its demands for international support and assistance. Most of those sites are loosely connected to one another. One explanation for it might be that as they are often associations and NGOs and so organisations that depend on individual funding. Therefore, they are directly competing with each other for this financial support. The fact that the centre of the nod is the Alofa Tuvalu association website, one of the few that does not incorporate a direct link for donation, reinforces this hypothesis.
The second one, located on the upper right, gathers predominantly anti-Tuvalu websites understood as actors refuting Global Warming as a whole or that it is responsible for Tuvalu impendent doom. Their respective positions are more various than in the first group but they still tend to be very connected to each other. This should not come as a surprise though as despite some differences in their views, climate sceptic websites are generally part of networks and tend to interconnect each other by providing multiple links to websites alike.
The ring surrounding these two groups is harder to describe. No classification seems to fit to explain it as the websites differ in type, nationality or position on or in the controversy. All that can be said is that the proportion of “Pro-Tuvalu” websites is higher than compared to the rest of the graph, a situation one might connect to the previous hypothesis on the economical competition between associations and NGO’s.
The network of the Tuvalu controversy is rather consistent with what other tools and methods have brought to the understanding of the controversy and how it started and evolved throughout time. For long, Tuvalu was not hot news but most of the studies and actors were advocating the idea that Global Warming was the main reason for its programmed sinking into the Pacific Ocean. The 2000’s decade, culminating with the Copenhagen Climate Conference, elevated Tuvalu to the rank of global symbol and first actual laboratory for Global Warming induced legal, political and practical issues. Therefore, when new studies were published using the data provided by more accurate measuring system such as the SEAFRAME tide gauges network and concluding that over the past 20 years, sea-level has been particularly stable in the region, new actors entered the controversy while former ones repositioned themselves.
Among those new actors, the vast majority was composed of climate sceptics who used the symbol that Tuvalu has become for denouncing the so-called Global Warming scam. Because the climate sceptic network was already strong and very organised on the internet, those actors soon become very loud and present in the debate and particularly prone to echo and use the scientific material that Australian research centres were providing. In the mean time, historical non-scientific actors, mainly associations, NGOs and Tuvalu civil society had to find new grounds for basing their claims to their right to international support and assistance. Some chose not to speak about the causes of their pending disappearance to focus on the emergency of the situation while other have started basing their claims on human right. Only a handful of them kept using scientific studies and data to advocate their position, something that appears very clear when observing the graphs representing the network.


